
Lay the five sheets in their numbered order and British Columbia refuses to remain one colour. The first is spare and linear: black railways, orange highways and points for airports. The second washes the ground with altitude. Yellow and orange take over for agriculture, green sorts the forests, and ochre gathers the mineral record. Coastline and latitude hardly move, yet the province changes character every time a new key is applied.
All five are headed Report on Resources and Railways, 1947. They were prepared by the Geographic Division of the Surveys Branch, Department of Lands, Province of British Columbia, and extend beyond the provincial boundary into parts of Yukon, Alaska, Alberta and the Northwest Territories. At roughly 55 by 42.5 centimetres, each is large enough to make the north legible and small enough to travel as a folded paper sheet.
Together they offer something that an isolated map cannot. The same railway lines pass through different layers of evidence, allowing movement, terrain and resources to be compared without redrawing the province in the mind. Numbering turns five maps into a sequence; repetition turns the sequence into an argument.
Why five maps belong together
The family resemblance begins in the lower-left panel. A provincial crest sits above the report title, followed by British Columbia in heavy lettering and a subtitle naming the adjoining territories. Scale, subject and legend follow in the same position. Only the last word and its graphic language change: Transportation, Physical, Agriculture, Forests, Minerals.
Small consistencies do practical work. The neatline returns, the coast occupies the same side of the sheet, and the railway can be found without relearning the design. A comparison can therefore begin almost immediately. Follow one line on Transportation, locate it again beneath the altitude tints, then see which agricultural, forest or mineral marks lie beside it. The set is built for looking back and forth.

The sequence also has a documented setting. A later British Columbia Department of Railways bulletin, issued in 1949, describes an enquiry into the Pacific Great Eastern Railway, possible northern extensions and the resources that might support traffic and settlement. Its numbered map-sheets reproduce these same five subjects. That report does not settle every question about how these particular copies circulated, but it explains why railways remain visible even when the announced topic is soil, timber or minerals.
A loose sheet may still be an original object of interest. As a group, however, the maps become a comparative instrument. Their order moves from access to terrain and then towards three categories of productive land. The design asks the reader to keep returning to one base geography and notice what a new layer makes prominent—or leaves unrecorded.
Map 1: movement
Transportation is the armature. Existing railways run in dark lines, proposed extensions break into dashes, highways take a warmer colour and airports become small orange points. Across the north, route possibilities reach towards Yukon and Alaska; eastward connections make Alberta part of the frame. The province is not pictured as a sealed shape. It is a field of approaches and exits.

The distinction between solid and broken lines carries much of the historical charge. One belongs to an operating network; the other puts an unrealised route onto the same sheet. The map therefore joins description to possibility without confusing them. A reader can trace where steel already ran and where an extension might reorganise the relationship between coast, interior and northern boundary.
That emphasis agrees with the questions recorded by the railway enquiry: which resources might produce traffic, where an extension could run and how transport might affect northern development. It would be too strong to say that every orange or dashed line became policy. On the paper, they are proposals set into a common visual field—future movement made comparable with existing movement.
Map 2: relief and physical resources
The second sheet replaces the clean transport diagram with altitude tints. Mountains acquire breadth, valleys become openings and the coast breaks into its long, intricate edge. Roads, trails and railways have not vanished; they now cross a terrain that explains why some lines gather in corridors while other areas remain difficult to enter.

This is where the set begins to work across sheets. On Transportation, a route can look like an administrative decision drawn between names. On Physical, the same direction meets river systems, high ground and the narrow passages between them. The 1949 bulletin specifically draws attention to waterways and lower-altitude routes. Geography is not background decoration here; it is the condition against which any transport proposal has to be read.
The phrase “physical resources” also deserves care. Modern readers might expect a broad ecological portrait. The map instead organises landform and access for the questions the report is pursuing. Its colours are explanatory, but selective: they clarify obstacles and opportunities rather than attempting to record every relationship people held with the land.
Maps 3 and 4: agriculture forests
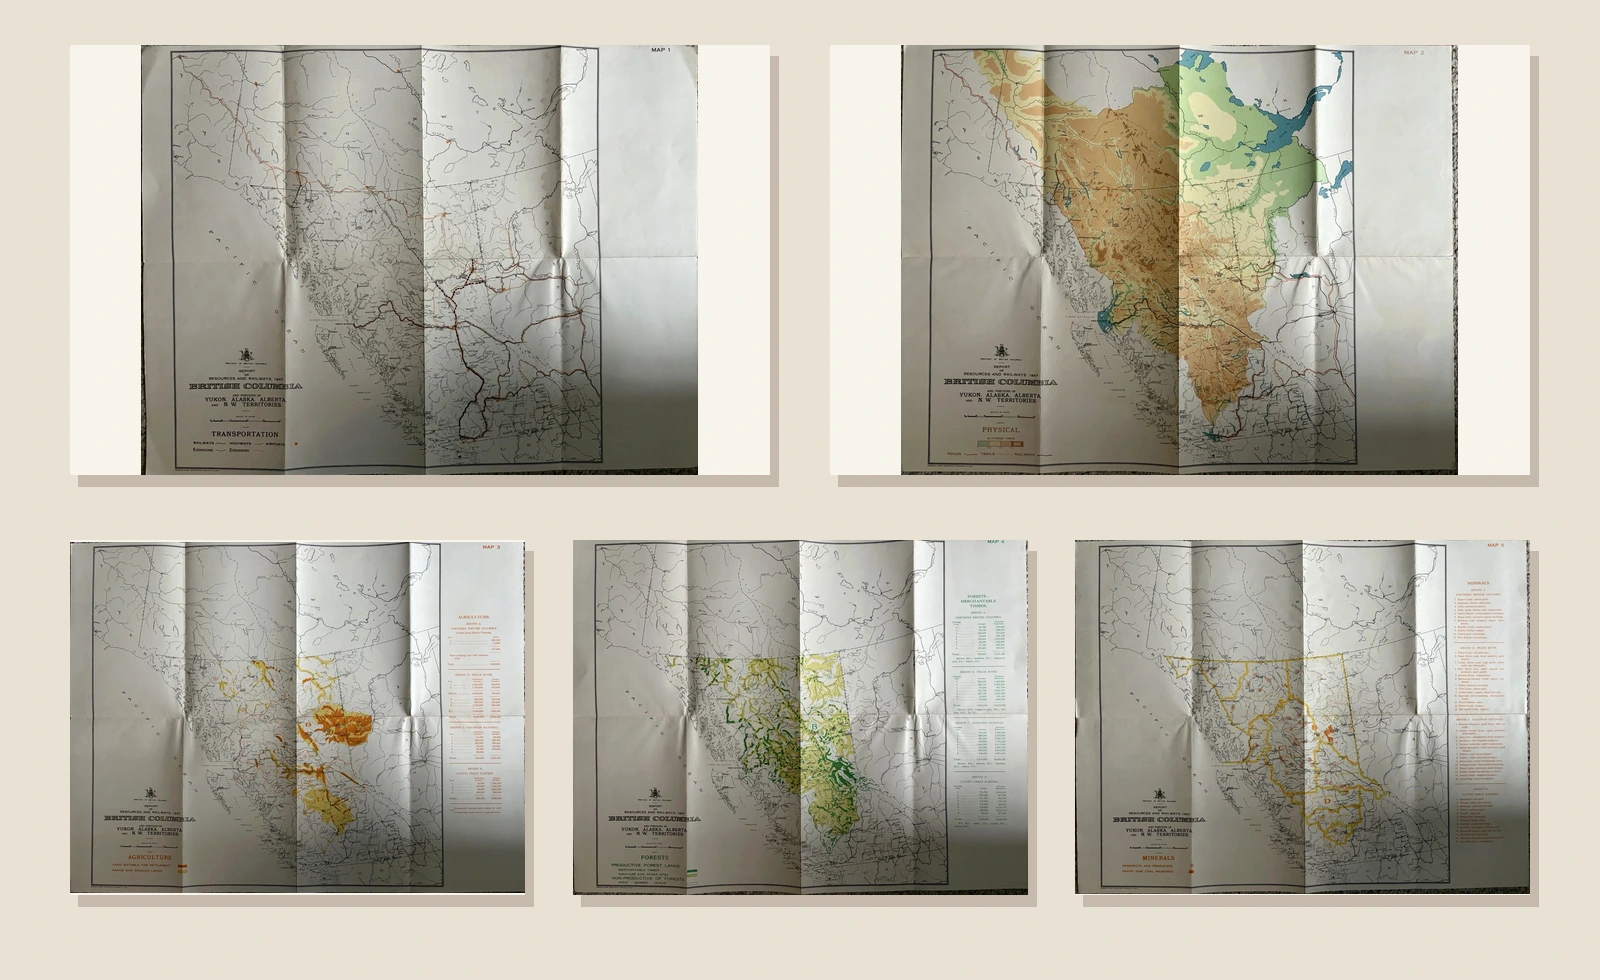
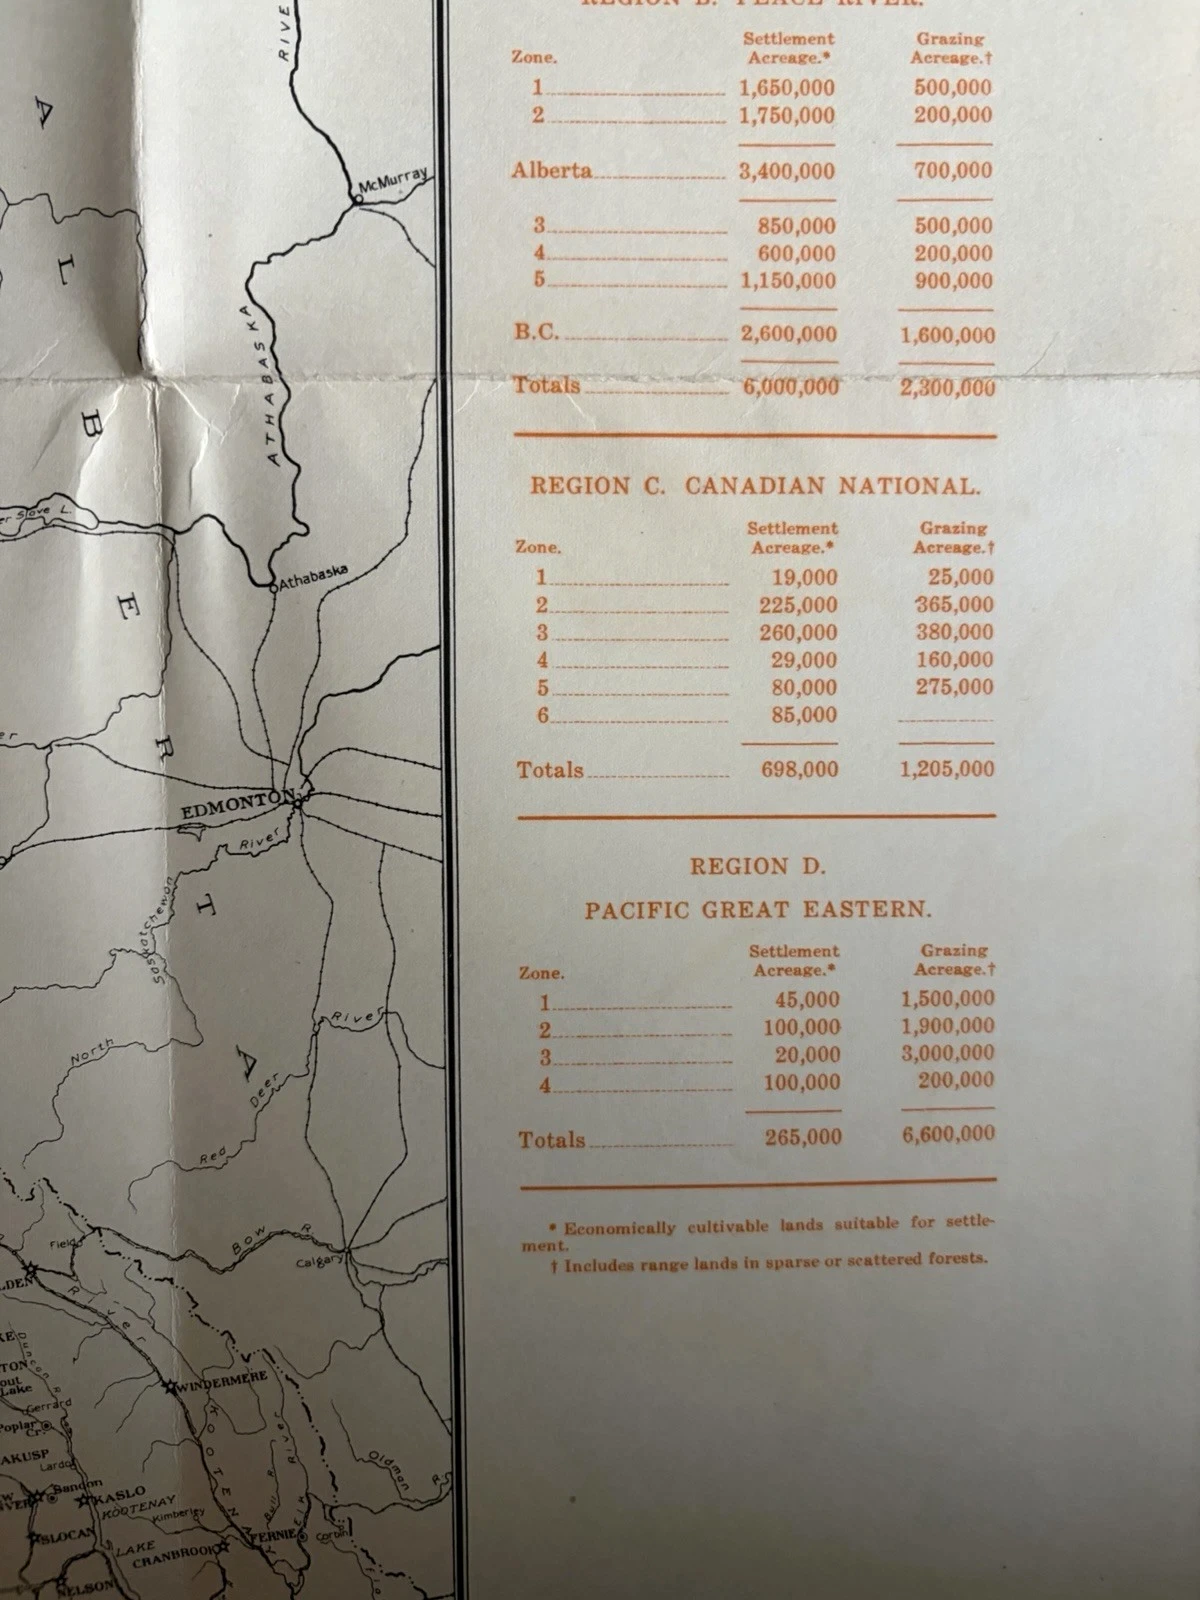
Agriculture and Forests divide the same ground in incompatible but complementary ways. The agricultural sheet uses yellow and orange to distinguish land described as economically cultivable for settlement from range or grazing country. Its acreage categories reduce extensive, varied terrain to a small set of comparable quantities. The forest sheet answers with green classes: productive or merchantable forest, immature forest, and land placed outside those categories.
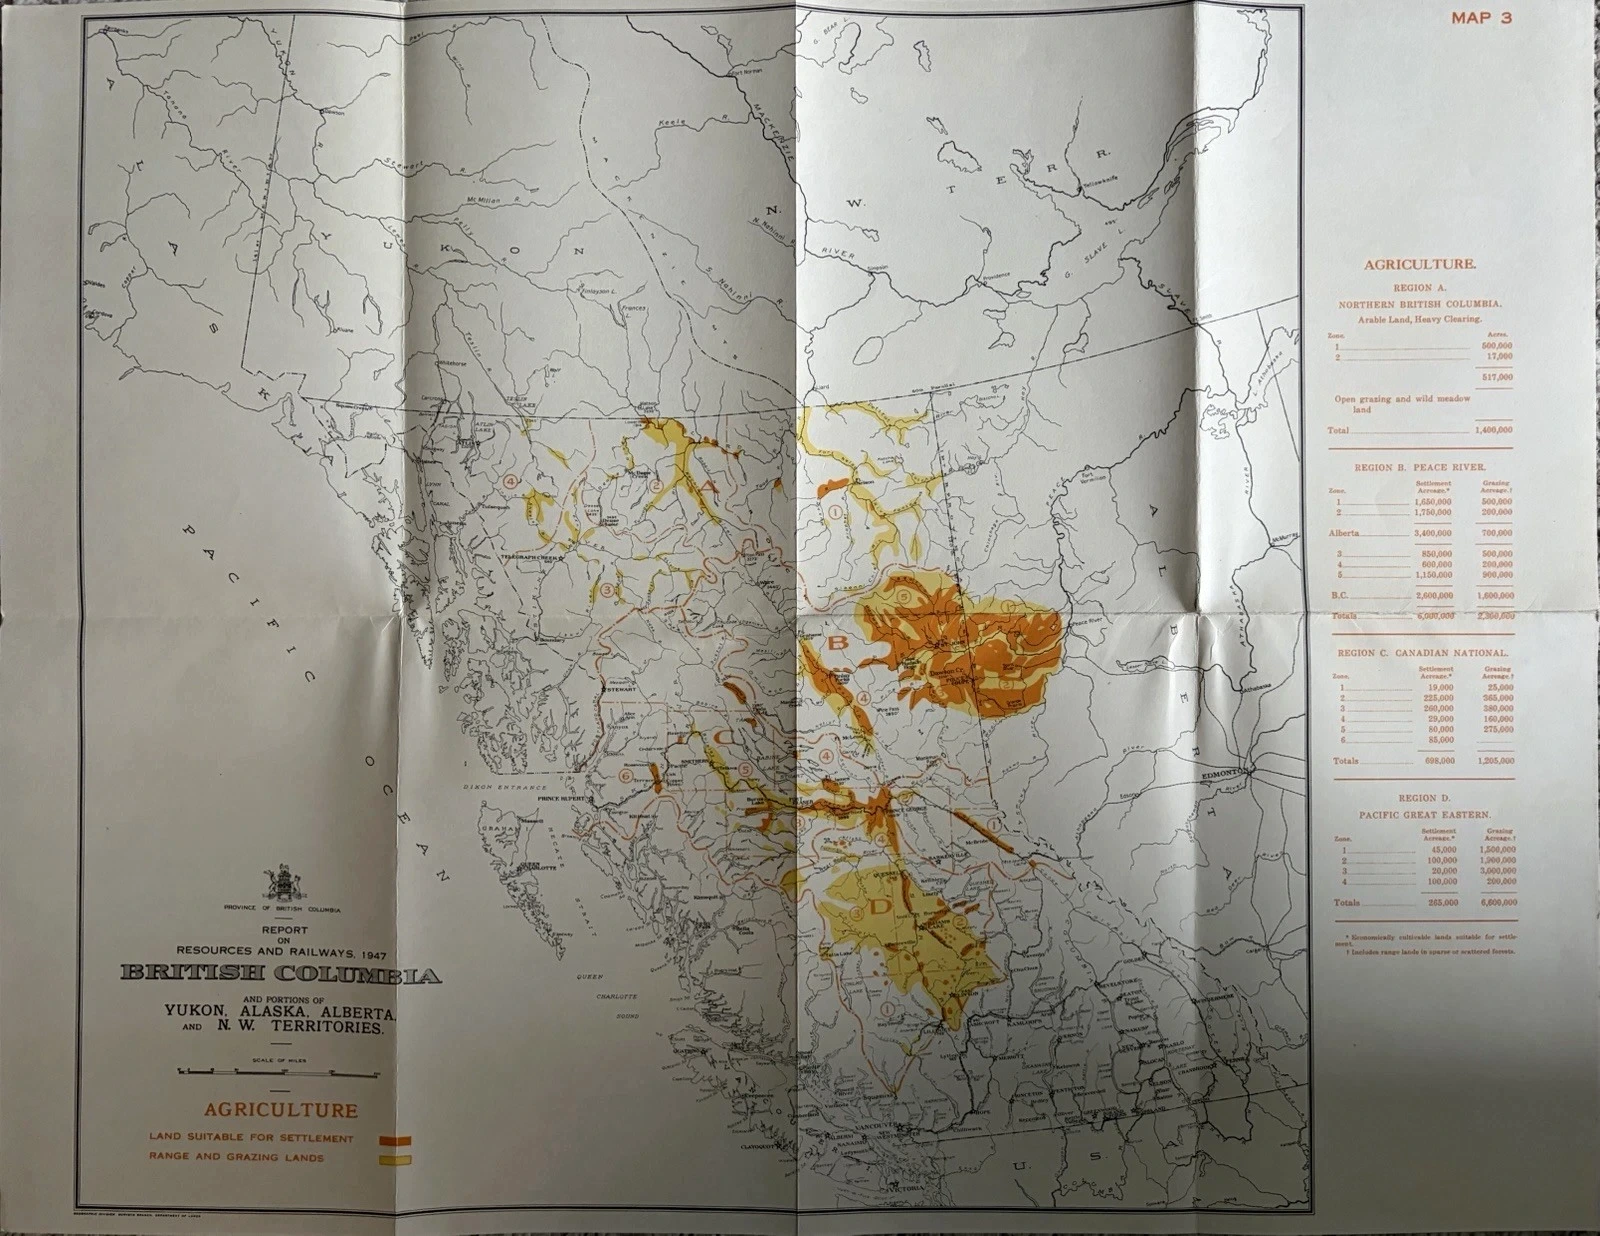
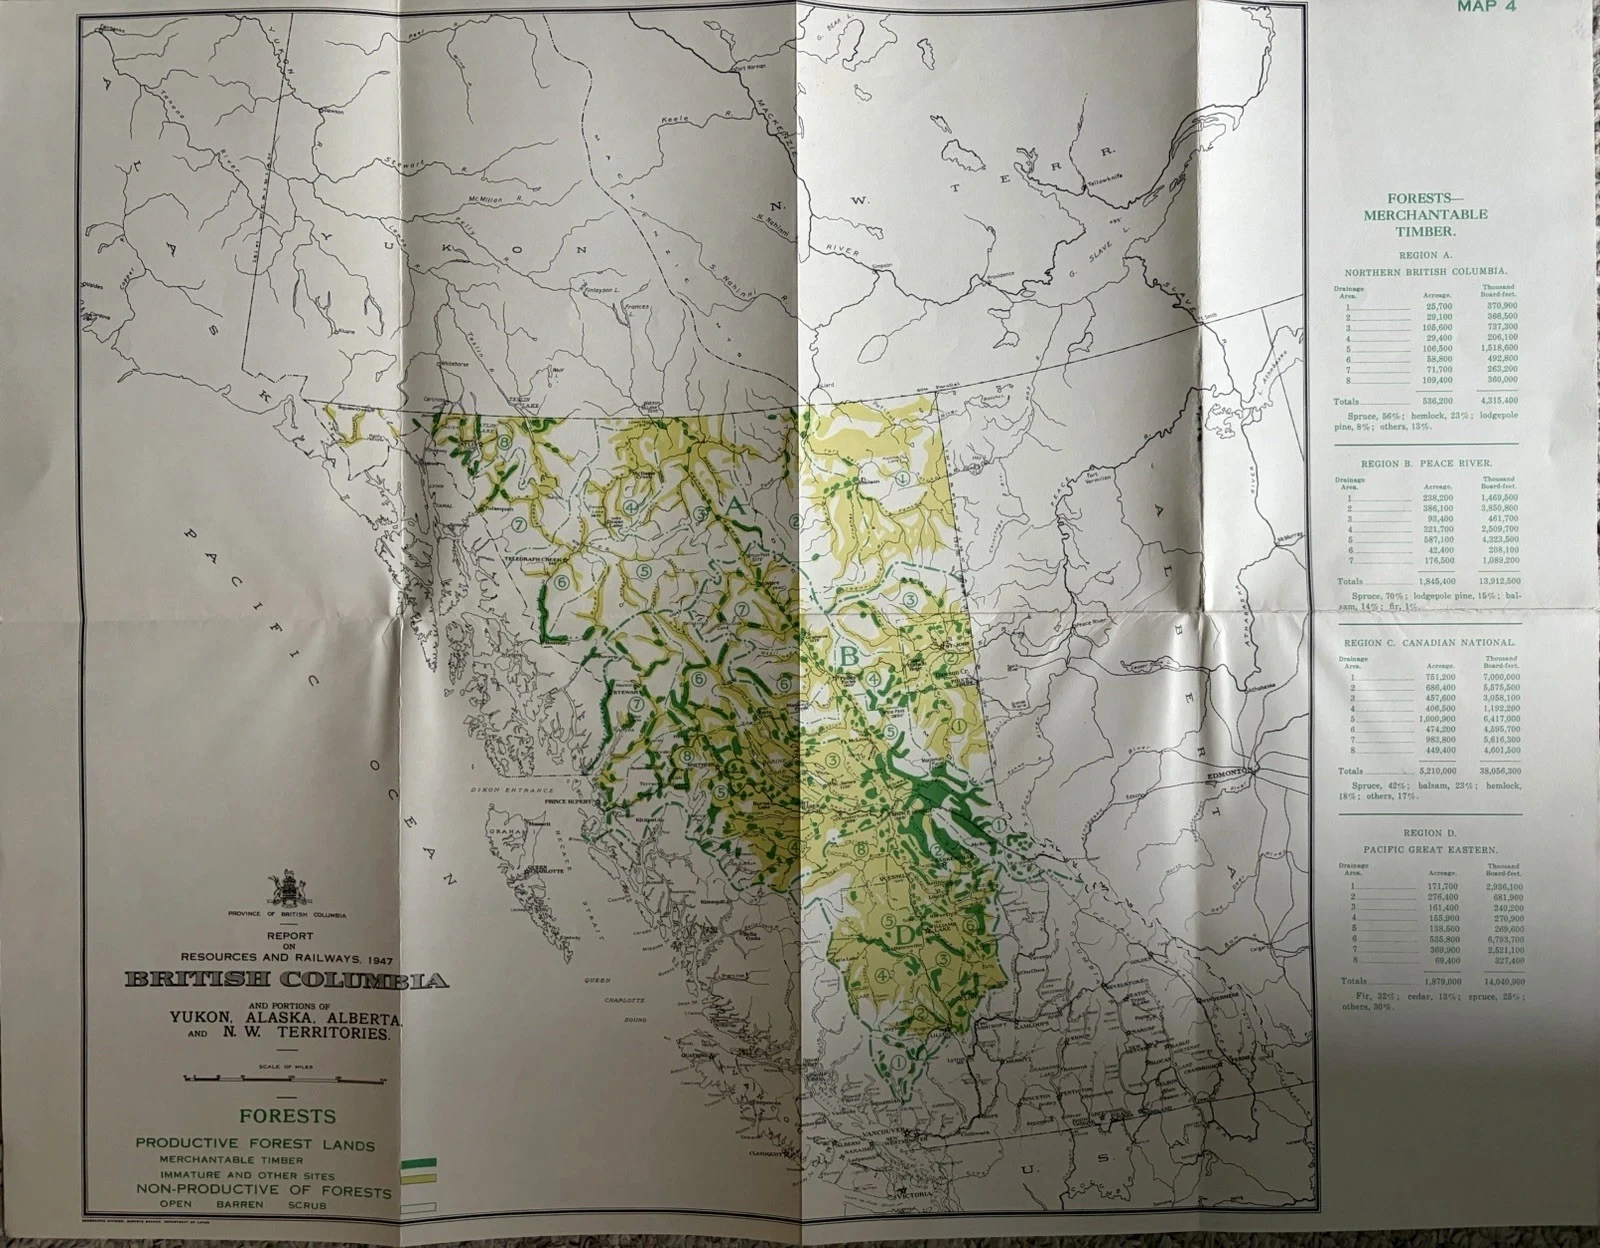
The accompanying tables make the act of classification explicit. Agriculture totals land by region, while the report explains that grazing could include range within sparse or scattered forest. Forest tables count timber volume in thousands of board-feet and add species percentages. A coloured patch is therefore not a picturesque description. It belongs to a definition, a unit and an administrative region.
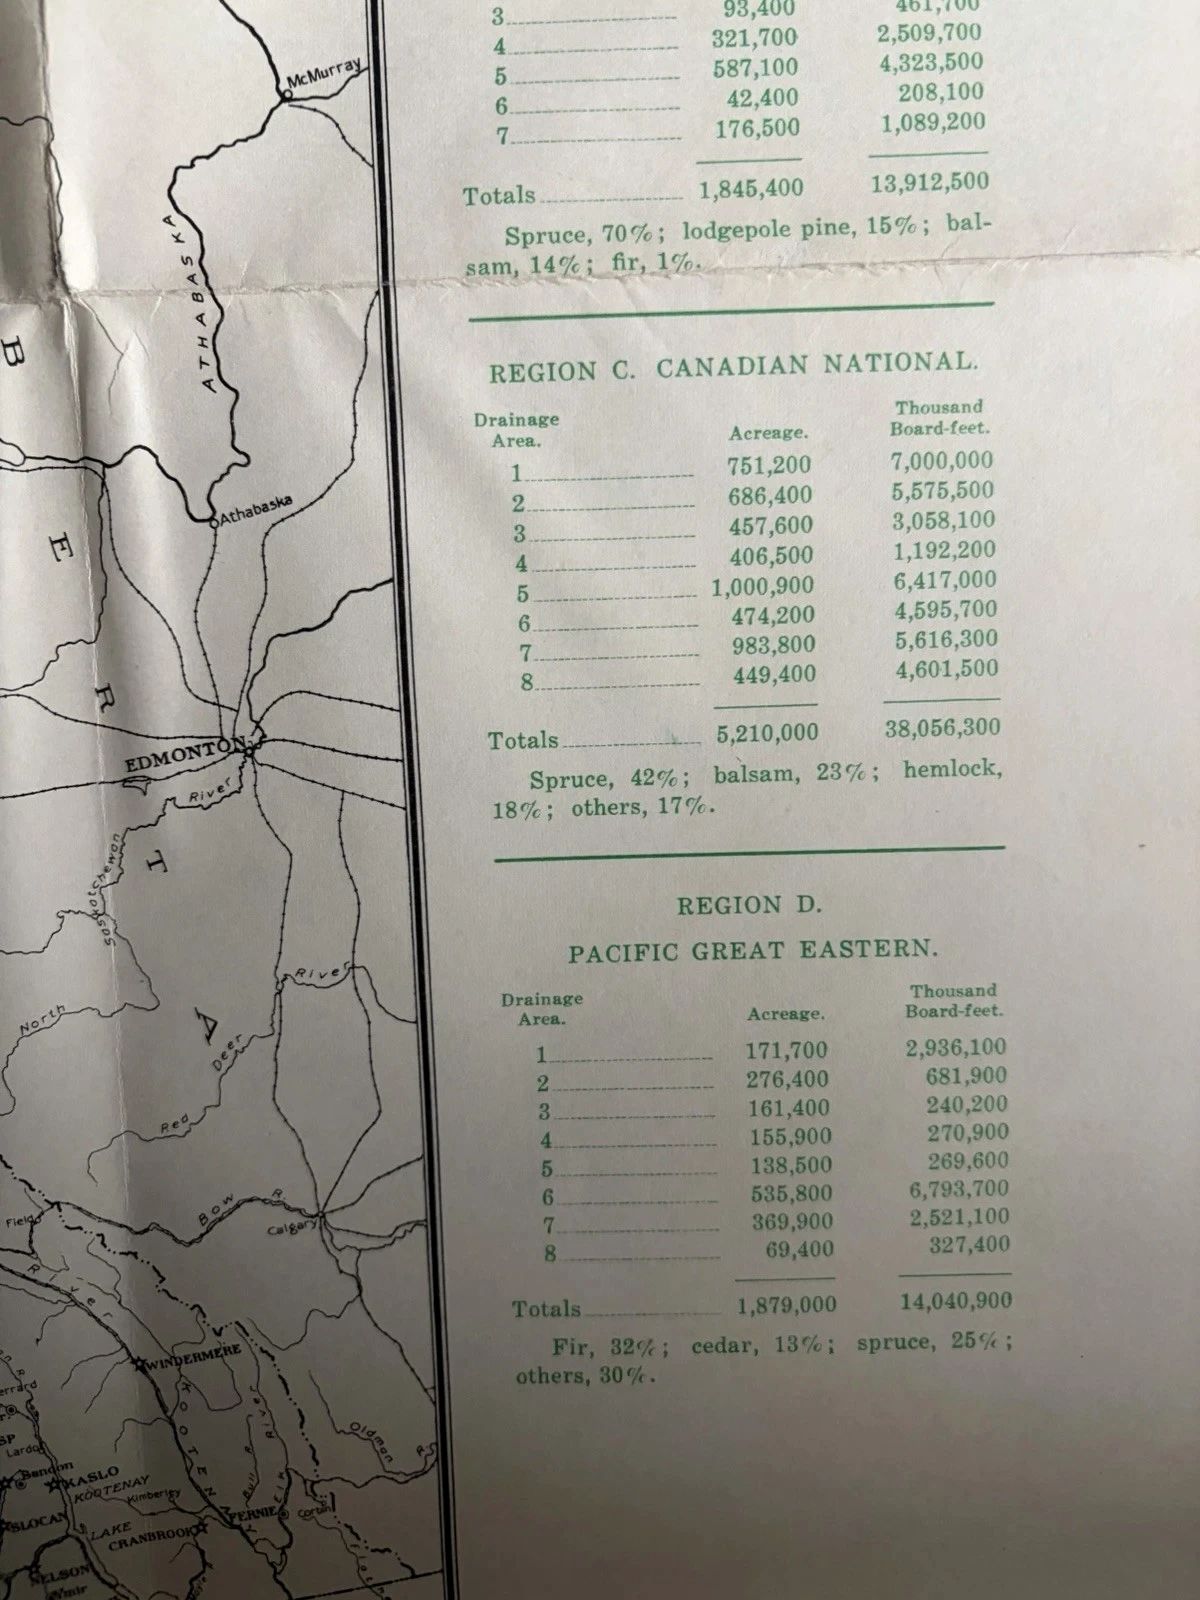
Placed together, the two maps also expose the consequences of a key. The same wooded area may be “grazing” when read for agriculture and a forest class when read for timber. Neither label is the land itself. Each is a tool shaped for a distinct enquiry. The value of owning both sheets lies precisely in seeing that change of vocabulary happen.
Map 5: minerals
Minerals replaces broad washes with points, symbols and lists. Prospects are distinguished from producers; coal measures in the Peace–Pine area receive their own treatment; commodity and activity notes are organised through four report regions. A reader moves between marks on the map and written inventories at the side, translating location into a period summary of known or reported extraction.

The distinction between a prospect and a producer is essential. One records an indication or investigation; the other denotes activity of a different order. Once that difference is lost, the sheet can be made to promise more than it says. Nor should its lists be treated as a timeless inventory of British Columbia. They are a 1947 arrangement of information, printed for a report concerned with railway access and potential traffic.
Minerals is numbered fifth, but it does not finish the story by delivering a single conclusion. Instead, it sends the eye back to Transportation. A cluster matters differently depending on its distance from an operating line, a proposed extension or a low route established on the Physical map. The last sheet makes the first one newly legible.
What the repeated railway reveals
Across all five maps, the railway network behaves like a registration mark. It keeps the thematic layers aligned. Transport gives it centre stage; relief explains its difficulties; agriculture and forests place productive categories around it; minerals supplies points that might be connected to it. The repetition is not redundant. It is the mechanism that allows comparison.

That common base also identifies the series’ point of view. The province is repeatedly made knowable through resources, movement and development. Other geographies are not given equivalent space. For a present-day counterpoint, the First Peoples’ Cultural Council’s First Peoples’ Map of B.C. begins with Indigenous languages, communities and place names. It is not a correction layer to lay mechanically over a 1947 railway report; it demonstrates how thoroughly the meaning of a map changes when the organising question changes.
The contrast keeps admiration for the historic cartography from becoming agreement with every category it uses. These five sheets are beautifully coordinated records of a particular administrative enquiry. Their exclusions belong to the evidence too.
How to recognise an incomplete set
Begin with numbering and title architecture. A complete group should contain Transportation, Physical, Agriculture, Forests and Minerals, each dated 1947 and carrying the same report title, provincial crest, geographic extent and Surveys Branch credit. Differences of colour are expected; differences of scale, title wording or outer coverage deserve closer inspection.
Do not rely on a seller’s use of “set” by itself. Ask for photographs showing each legend, every outer edge and both sides of all fold intersections. If one thematic title is absent, a visually similar provincial map should not be accepted as a substitute merely because its date is close. Conversely, modest differences in toning or fold pattern are unsurprising: these are separate working sheets, not pages sewn into one atlas.
The five-sheet test. Check for all five thematic names; the numbered sequence; matching crest and report wording; the recurring railway base; subject-specific keys and tables; and a broadly consistent folded format of about 55 by 42.5 centimetres. Photograph the lower-left panel of every sheet before purchase. It will usually settle the set question faster than a view of the map centre.
Condition should be read map by map. These copies show folds, creasing, toning, small stains and edge wear in varying degrees. A fold intersection may weaken even when the printed field looks complete in a general photograph, while a lost margin can remove a credit or part of a key. Five sheets present together are not necessarily five sheets equally intact.
The principal loss in an incomplete set is the ability to compare the same railway network across all five subjects. Map 4 alone remains a useful British Columbia forest map; Map 1 alone is a strong transport document. Only the group shows how the same railway question was carried through relief, cultivation, timber and mineral symbols. The collector who reunites the sequence recovers a reading method as well as five maps.
Sources and further reading
This article considers five original maps from the Province of British Columbia’s Geographic Division, Surveys Branch, Department of Lands: Transportation, Physical, Agriculture, Forests and Minerals. The photographs of these copies supply the dates, printed credits, keys, dimensions and condition details cited above.
Library and Archives Canada provides a digital copy of the British Columbia Department of Railways’ Pacific Great Eastern Railway, also Proposed Extensions and Potential Resources of Central Interior and Northern British Columbia, published in 1949. It supplies the committee context, regional framework, map-sheet sequence and definitions used in the tables. It does not establish the ownership history of these individual sheets. For comparison at a broader scale, a 1965 map of African transport routes and a Britannica map of Canada show two other ways a network or country can be compressed into a portable printed view.